Learn the fundamentals of machine learning and how to start building your own AI models.
Step 1: What is Machine Learning?
Machine Learning (ML) is a subset of Artificial Intelligence (AI) that enables systems to learn and improve from experience without being explicitly programmed.
Instead of writing code with specific instructions for every possible scenario, machine learning uses data to train models that can make decisions, detect patterns, or even make predictions.
🔍 Key Concept
At its core, machine learning is about creating algorithms that can take data as input and use statistical analysis to predict an output while updating outputs as new data becomes available.
📊 Types of Machine Learning
- Supervised Learning: The model is trained on a labeled dataset (input/output pairs). Example: Spam detection in emails.
- Unsupervised Learning: The model finds hidden patterns in data without predefined labels. Example: Customer segmentation.
- Reinforcement Learning: The model learns by interacting with an environment and receiving feedback through rewards or penalties. Example: Teaching an AI to play a game.
🌍 Real-World Applications
Machine learning powers many technologies we use daily:
- Netflix and Spotify recommendations
- Voice assistants like Alexa and Siri
- Medical diagnostics and disease prediction
- Self-driving cars
- Fraud detection in banking
📈 Why It Matters
As the amount of data we generate grows exponentially, machine learning provides scalable, efficient solutions for understanding and acting on that data.
It's revolutionizing industries and opening doors to smarter, data-driven decision-making.
Step 2: Setting Up Your Environment
Before you can build and train machine learning models, you need to set up a development environment where you can write and execute Python code.
In this step, we’ll guide you through installing the necessary tools, including Python, pip (Python's package manager), and some popular data science libraries like NumPy, Pandas, Matplotlib, and Scikit-learn.
💻 What You'll Need
- A computer with Windows, macOS, or Linux
- Python 3.7 or later
- Internet connection to install libraries
- A code editor or IDE (e.g., VS Code, Jupyter Notebook, or PyCharm)
📥 Step-by-Step Setup
-
Install Python:
Download the latest version of Python from the official Python website. Make sure to check the option that says “Add Python to PATH” during installation.
-
Verify Python and pip:
Once Python is installed, you’ll want to make sure everything is working correctly by checking the versions of Python and pip (Python’s package installer).
Open a terminal or command prompt:
- Windows: Search for "Command Prompt" or "cmd" in the Start Menu.
- macOS: Open "Terminal" from Applications > Utilities.
- Linux: Use your default terminal application.
Now type the following commands one at a time and press Enter after each:
python --version
This will output something like:
Python 3.11.6
pip --version
You should see something like:
pip 23.3.1 from C:\Users\YourName\AppData\Local\Programs\Python\Python311\Lib\site-packages\pip (python 3.11)
If you see both versions without errors, it means Python and pip have been installed successfully. If you get an error saying "python is not recognized," go back and make sure Python was added to your system PATH during installation.
-
Install Required Libraries:
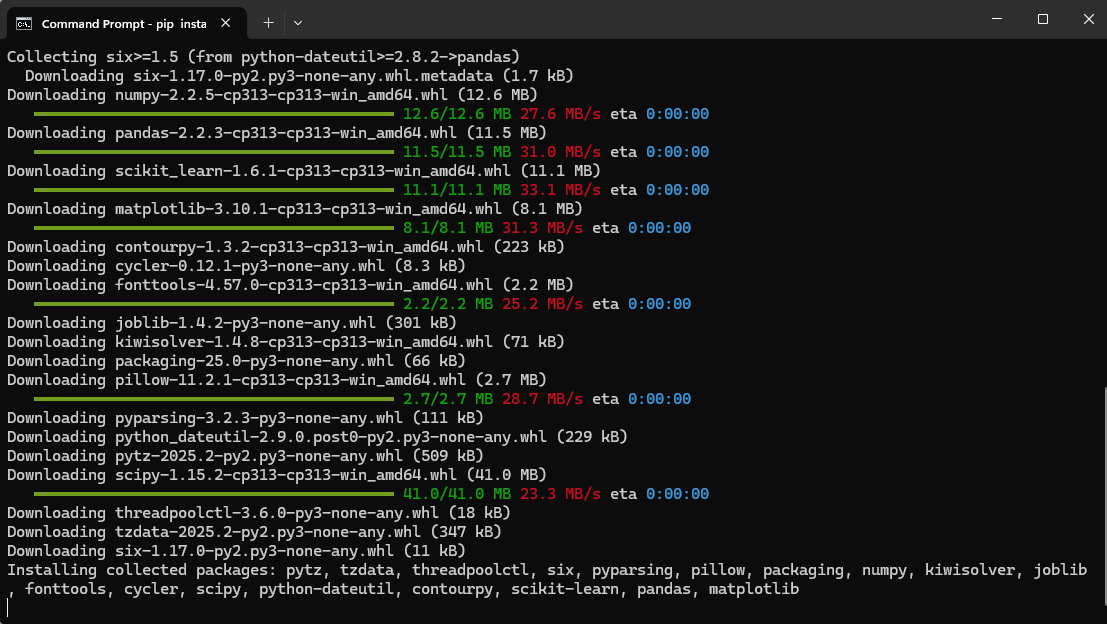
Open your terminal or command prompt and run the following command to install all required libraries in one go:
pip install numpy pandas scikit-learn matplotlib
Step 9: Understanding Test Data and Scaling
Now that you have learned how to scale your data, let’s break down what this means and why it's important. In this step, we’ll explain the test data, its role, and how scaling affects it.
1. The Data
The dataset you used looks like this:
    Age    Income    Target
    25     30000     Yes
    30     40000     No
    35     50000     Yes
    40     60000     No
In this case, you are predicting the Target column (either "Yes" or "No") based on Age and Income.
2. Separating Features and Target
You separated the features (Age, Income) and the target (Target) using the following code:
    X = data.drop('target', axis=1)  # Features (Age, Income)
    y = data['target']  # Target (What we're predicting)
Now:
- X contains the features:
Age and Income.
- y contains the target:
Target (Yes or No).
3. Scaling the Data
Next, you scaled the data using the StandardScaler:
    scaler = StandardScaler()
    X_train = scaler.fit_transform(X_train)
    X_test = scaler.transform(X_test)
This scaling process normalizes the data so that both features (Age and Income) have the same scale, typically with a mean of 0 and a standard deviation of 1. This step is crucial because machine learning models work better when the features are on similar scales.
4. The Output: Scaled Data
After scaling, you will see the following output for the training and test data:
    Training Data (Scaled):
    [[ 0.          0.        ]
     [-1.22474487 -1.22474487]
     [ 1.22474487  1.22474487]]

    Test Data (Scaled):
    [[-2.44948974 -2.44948974]]
Let’s break this down:
- The mean age in your data is 32.5 (average of 25, 30, 35, 40).
- The standard deviation tells us how spread out the ages and incomes are.
After scaling, each value is adjusted relative to the mean and standard deviation of its respective feature. For example:
[0. 0.] means Age = 35 and Income = 50,000, which are normalized to the average values.[-1.22, -1.22] means Age = 30 and Income = 40,000, which are below the average.[1.22, 1.22] means Age = 40 and Income = 60,000, which are above average.
For the Test Data:
[[-2.44, -2.44]] indicates that the test data (which we haven’t seen before) has values significantly lower than the average, so they are scaled to be below 0.
5. Why Scaling is Important
Scaling helps machine learning algorithms learn more efficiently, especially for models sensitive to the scale of data, such as:
- Logistic regression
- Support vector machines (SVM)
- K-nearest neighbors (KNN)
Without scaling, one feature (e.g., Age) might dominate the model if it’s on a different scale than another feature (e.g., Income). Scaling ensures that all features are treated equally during training.
Next Steps
Now that your data is scaled, you’re ready to train your machine learning model. Once trained, you can test the model on unseen data (like the Test Data) to see how well it performs.